

When you invest real money in digital campaigns, you need to track the key metrics that drive revenue. Vanity stats can look impressive, but only a handful of indicators tell the true story of ROI. In this expanded article, you will learn:
- What each metric means in plain English.
- Why it matters specifically for e‑commerce and high‑growth brands.
- Five proven ways to improve every KPI (including tool suggestions).
- The marketing channels—paid and organic—that have the most significant impact.
Use this as both a checklist and a playbook to refine your dashboards, optimize spend, and turn data into a competitive advantage.
Paid vs. Organic KPIs: How to Balance Decisions
Digital marketers often track the same metric names—impressions, clicks, conversion rate, revenue—across both paid and organic efforts. Yet the underlying economics behind those numbers differ wildly and should influence how you allocate budget and attention.
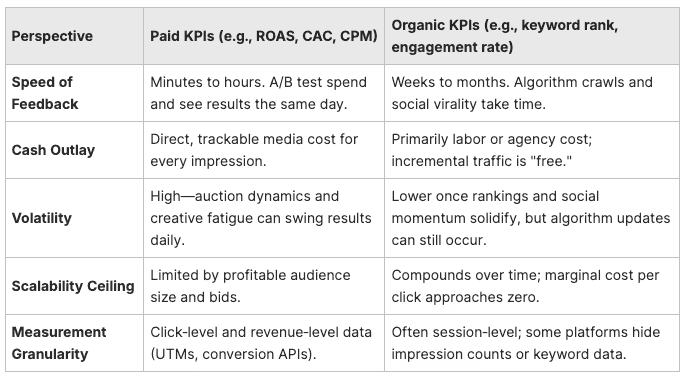
Decision‑making rule of thumb:
- Lean on paid KPIs for short‑term revenue targets, product launches, and validating new offers.
- Use organic KPIs to judge long‑term brand health, lower blended CAC, and defend margins during ad‑cost spikes.
- Blend both in an MER (Marketing Efficiency Ratio) dashboard so you can see total revenue divided by total spend, preventing channel teams from optimizing in silos.

Channel Transparency: What Data You’ll See (and Why It Matters)
Different channels expose different slices of the funnel—knowing the gaps prevents false conclusions when comparing performance indicators.
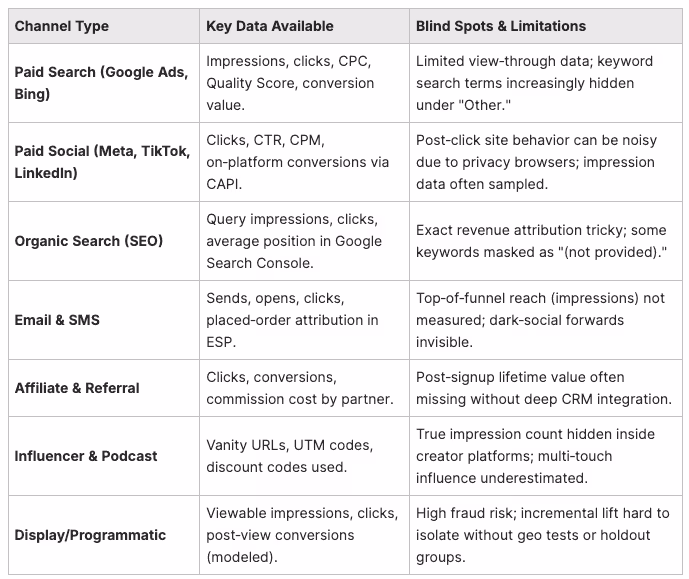
Why this matters:
- If a channel doesn’t expose impression data (e.g., SEO, email), CTR comparisons with paid media are meaningless.
- Channels with modeled conversions (display, paid social post‑view) inflate ROAS if you don’t de‑duplicate events in your attribution tool.
- For influencer or podcast spends, supplement platform stats with post‑purchase surveys to capture the hidden impact.
Keep these visibility gaps in mind when setting KPI targets; adjust expectations and weighting so channels are judged by the data they can provide.
1. Customer Acquisition Cost (CAC)
Key performance indicator: how much it costs to buy one new customer
Why CAC matters for business owners
Customer acquisition cost is the clearest lens on profit potential. If you spend $60 to win a buyer who only ever spends $50, your model breaks. Owners need CAC benchmarks to set pricing, decide on marketing budgets, and forecast cash flow. High CAC forces companies to raise capital or cut growth, while low CAC compounds margins and fuels reinvestment. For recent industry averages, review HubSpot’s customer acquisition cost benchmark report.
Why CAC matters for e‑commerce stores
Shopify retailers live and die by blended CAC—the total dollars spent across online advertising, affiliate deals, and organic content divided by new customer count. When marketplace fees and fulfillment costs rise, controlling CAC keeps net profit healthy.
Five ways to improve CAC
- Laser‑focused targeting. Build look‑alike audiences based on your highest‑LTV customers instead of broad demographics.
- Optimize the first‑time offer. Free shipping or a small bundle discount can lift conversions without eroding average order value.
- Reduce checkout friction. One‑click payments like Shop Pay often slash drop‑off rates.
- Leverage owned media. Email, SMS, and loyalty programs bring customers back without additional ad spend.
- Cut waste in paid search. Add negative keywords and refine match types so you stop paying for irrelevant search‑engine queries.
High‑impact channels and tools
- Google Search Ads for bottom‑funnel intent.
- Meta Advantage+ Shopping campaigns for algorithmic prospecting.
- Affiliate and referral software (Refersion, SaaSquatch) where customers recruit customers.
- Content‑led SEO that ranks in search engines for pain‑point queries.
2. Return on Ad Spend (ROAS)
Key performance indicator: revenue divided by ad spend on a channel
Why ROAS matters
ROAS is the financial speedometer for online advertising. A 2× ROAS means you make two dollars for every dollar spent. That may work if your gross margin is 70 percent. It fails if your margin is 25 percent. Executives watch ROAS daily to rebalance budgets across Google, Meta, Amazon, TikTok, and programmatic display. Google explains how Smart Bidding optimizes for profitability in its Target ROAS guidelines.
Five ways to improve ROAS
- Message match. Align ad copy, creative, and landing‑page headlines so users instantly see relevance.
- Feed optimization. Clean product titles and add rich attributes to improve Google Shopping and Meta catalog performance.
- Creative‑fatigue rotation. Refresh static images every seven days and video hooks every fourteen to keep CPMs low.
- Smart bidding with guardrails. Use Target ROAS but cap maximum CPC to avoid bidding wars.
- Post‑purchase upsells. A quick‑add accessory can raise AOV ten to fifteen percent, pushing ROAS higher at the same click cost.
Top channels
- Performance Max and Shopping (Google).
- Advantage+ Shopping Campaigns on Meta.
- TikTok Spark Ads with viral UGC.
- YouTube TrueView for Action in high‑touch consideration stages.

3. Conversion Rate (CVR)
Key performance indicator: percentage of visitors who complete the desired action
Why CVR matters
Every traffic source—search‑engine results, social ads, email—drops potential buyers onto a page. If only one percent convert, ninety‑nine percent of ad dollars are wasted. Raising CVR to two percent doubles revenue without an extra penny in ad spend. For twenty‑six practical tests, check Unbounce’s conversion‑rate optimization tips.
Five ways to improve CVR
- Declutter above the fold. Put the product image, price, and CTA button in instant view on mobile.
- Add social proof at checkout. Live sales popups and review badges calm last‑minute hesitation.
- Speed matters. A one‑second delay can drop CVR by seven percent. Compress images and use a CDN.
- Exit‑intent offers. Capture emails with a discount before visitors leave.
- Localized messaging. Auto‑show currency, shipping time, and testimonials that match the visitor’s region.
Helpful tools
A/B testing platforms (Convert, VWO), heatmaps and session replay (Hotjar, Clarity), and one‑click wallets such as PayPal or Apple Pay.
4. Lifetime Value (LTV)
Key performance indicator: total net profit attributed to a customer over their lifespan
Why LTV matters to owners
Higher LTV lets you spend aggressively on acquisition while staying profitable. It also makes your company more valuable for exit because predictable cash flows reduce risk. Shopify’s guide on how to calculate customer lifetime value walks through modern formulas.
E‑commerce takeaways
Subscription supplements, bundles, and loyalty perks lengthen the customer journey. Brands that push LTV from $100 to $150 can outbid competitors for paid search‑engine clicks that would otherwise be too expensive.
Five ways to improve LTV
- Subscription models. Offer auto‑ship with a small discount.
- Product education. Email flows that teach customers new use cases spike repeat orders.
- VIP tiers. Unlock early access and exclusive drops once customers cross a spend threshold.
- Exceptional support. Twenty‑four‑seven chat or SMS for returns management increases trust.
- Community building. Private Facebook or Discord groups deepen brand affinity.

5. Traffic‑Source Breakdown
Key performance indicator: share of sessions by channel and the quality of each source
Why it matters
Most sites blend paid online advertising with organic search‑engine traffic, email, direct, and social. Each source has different bounce rates, CVRs, and LTVs. Accurate traffic attribution shows where to pour gasoline and where to cut losses. GA4 documentation clarifies terminology in its overview of traffic‑source dimensions.
Five ways to act on traffic insights
- Fix UTM consistency to avoid the “other” bucket in GA4.
- Segment by intent layer and compare first‑click versus last‑click revenue.
- Run content gap analysis with Ahrefs to spot keywords where competitors rank but you do not.
- Track emerging channels like podcasts with QR codes and vanity URLs.
- Build dashboards that show CAC, LTV, and ROAS per source so you can pick winners quickly.
6. Click‑Through Rate (CTR)
Key performance indicator: clicks divided by impressions
CTR signals the resonance of your creative. On Google Ads, higher CTR improves Quality Score and lowers CPC. On Meta, good CTR keeps CPM reasonable. Low CTR in email hurts deliverability, so it is a universal health metric. WordStream publishes updated average Google Ads CTR benchmarks that show what “good” looks like across industries.
Five ways to improve CTR
- Craft pain‑point headlines that solve a problem.
- Use numbered lists and brackets, for example “7 Ways to Cut CAC [Free Guide]”.
- Choose strong visual contrast so products pop against neutral backgrounds.
- Create a curiosity gap such as “How We Cut Bounce Rate in Half”.
- Rotate creative weekly to prevent ad fatigue.
7. Bounce Rate and Engagement Rate
Key performance indicator: percentage of visitors leaving without interacting
A sky‑high bounce rate or low engagement rate means your landing page fails to meet expectations set by the ad or search‑engine snippet. Google explains its new engagement calculation in the GA4 engagement‑rate definition.
Five advanced fixes
- Match keyword intent to page content so the H1 and meta title line up.
- Put the value proposition in the first 400 pixels of the page.
- Add interactive elements such as quizzes or calculators.
- Lazy‑load assets so visible content appears first.
- Show contextual offers that differ for cold versus retargeting traffic.
8. Cost Per Lead (CPL)
Key performance indicator: ad spend divided by marketing‑qualified leads
Why CPL matters
SaaS trials, demo calls, and custom print orders live or die by CPL. If you spend $120 to generate a lead that closes at ten percent, your cost per acquisition is $1,200. Lower CPL gives sales teams more at‑bats without crushing margin. HubSpot provides a calculator and walkthrough of the cost‑per‑lead formula.
Five ways to lower CPL
- Offer high‑value lead magnets such as templates and audits.
- Use progressive forms that ask for email first then enrich later.
- Retarget warm traffic with tailored offers.
- Add qualification questions up front to save sales time.
- Co‑host partner webinars and share the resulting leads.

9. Organic Keyword Growth
Key performance indicator: number of keywords ranked and their SERP positions
Organic traffic carries no media cost, so every click lowers blended CAC. Ranking high for transactional keywords such as “buy custom tees online” delivers ready‑to‑buy traffic around the clock. Ahrefs lays out an eight‑step plan to grow organic keyword rankings.
Five ways to accelerate growth
- Map topic clusters with pillar and supporting blogs.
- Add schema markup for rich snippets, especially FAQ and product schema.
- Earn backlinks through data studies and digital PR.
- Refresh older content with new statistics and multimedia every six months.
- Sculpt internal links so authority flows to revenue pages.
10. Revenue Attribution by Channel
Key performance indicator: share of total revenue assigned to each marketing touchpoint
Without trustworthy attribution, scaling online advertising is a gamble. Multi‑touch models show how search‑engine discovery, email nurturing, and paid retargeting work together. GA4 offers model comparison inside its attribution model report.
Five ways to improve attribution accuracy
- Implement server‑side tagging to protect data as browsers kill third‑party cookies.
- Sync the Shopify customer ID into GA4 and Meta so events tie back to users.
- Run post‑purchase surveys to catch the influence of offline or dark‑social channels.
- Compare first‑click, data‑driven, and last‑click models before reallocating spend.
- Feed refund and return events back to ad platforms so ROAS metrics stay honest.
Essential Tools for KPI Tracking
Effectively monitoring these metrics requires more than spreadsheets—you need a toolset that pulls reliable data, stitches it together, and surfaces insights in real time. Below are the core categories and standout platforms most business owners and e‑commerce teams rely on.
1. Core Analytics & Dashboards
- Google Analytics 4 (GA4). Free, event‑based tracking for site and app behavior. Custom explorations let you slice CAC, bounce rate, and multi‑channel funnels without extra code.
- Looker Studio. Turns GA4, ad platforms, and Shopify exports into interactive executive dashboards. Blend data to visualize ROAS, LTV, and attribution in one view.
- BigQuery / Snowflake. Warehouses that centralize raw clickstream, ad spend, and order data—critical when you outgrow native reports.
2. Attribution & Ad Spend Intelligence
- Triple Whale, Northbeam, Hyros. Purpose‑built for DTC brands; pipe Shopify or Stripe revenue back into Meta, Google, and TikTok to see true channel ROAS.
- Segment & server‑side tagging. Future‑proofs pixel loss by sending first‑party events directly to ad platforms and GA4.
3. Behavior & CRO Insights
- Hotjar / Microsoft Clarity. Heat‑maps, session recordings, and on‑page surveys pinpoint why visitors bounce before converting.
- Convert / VWO / Optimizely. Run controlled A/B tests to validate hypotheses and lift conversion rate without guessing.
4. Lifecycle & Revenue Analytics
- Klaviyo / Omnisend. Email & SMS analytics break down open, click‑through, and revenue per recipient—ideal for improving LTV and CPL.
- Shopify Analytics or WooCommerce Reports. Tie SKU‑level sales to traffic sources for precise CAC and LTV calculations.
5. Reporting & Automation Layers
- Supermetrics / Funnel.io. Automate data pulls from 100+ ad networks into Sheets, Looker Studio, or your warehouse.
- Zapier / n8n. Send performance alerts to Slack, trigger budget changes, or push offline conversions back to Google and Meta.
Pro tip: Start lean—GA4 + Looker Studio will cover 70 percent of reporting needs. Layer specialized tools like Triple Whale or Hotjar once your monthly ad spend crosses key thresholds (e.g., $20k+ per channel).
Final thoughts
Each metric above is a performance indicator that connects marketing effort to profit. Master them and you will:
- Drop customer acquisition cost while lifting margin.
- Reduce bounce rate and turn more clicks into customers.
- Deploy online advertising budgets with confidence.
- Climb search‑engine rankings for sustainable traffic.
Ready to quantify and scale what works? Book a free strategy audit with Creative Culture 360 and unlock 20 to 50 percent more revenue from the same ad budget.

